前言
对于C/C++ 如果想分析某个函数测试用时时间,以及想从整体上分析代码效率如何,可以使用gprof工具来进行测试,并可视化生成每个函数模块的用时占比图。
GNU gprof
C++ gprof 使用方法
1.编译:
gcc -g -c myprog.c utils.c -pg
gcc -o myprog myprog.o utils.o -pg

g++/clang++ -g mysrc.cpp -o myprogram -pg  <other arg>
The `-pg’ option also works with a command that both compiles and links:
gcc/clang -o myprog myprog.c utils.c -g -pg注意:
如果使用了clang-14 之后的版本 , 默认使用DWARF V5版本, 而gprof 只支持到DWARF V4
就会出现一下错误:
BFD: DWARF error: invalid or unhandled FORM value: 0x25解决方法:
编译时修改 -g 为 -gdwarf-4
clang -o myprog myprog.c utils.c -gdwarf-4 -pg
如果不行, 参考:
2.正常执行程序 生成 gmon.out
./myprogram注意:gprof 要求程序能够正常结束,
您的程序必须正常退出:通过从 main 返回或调用 exit。 调用低级函数 _exit 不会写入配置文件数据,也不会由于未处理的信号而异常终止。
In order to write the `gmon.out’ file properly, your program must exit normally: by returning from main or by calling exit. Calling the low-level function _exit does not write the profile data, and neither does abnormal termination due to an unhandled signal.
如果想用gprof测试需要CTRL+C中断退出的程序
前文提到 gprof 必须要求程序正常退出, 而CTRL+C 中断信号等 不能正常生成gmon.out文件, 既然没有gmon.out文件也就无法分析性能,
调用exit(0) 针对像CTRL+C 不可行,
使用kill -15 PID 也无法生成gmon.out
解决方法:处理自定义信号 SIGUSR1
针对目前程序插桩, 使其调用外部函数, 外部函数中包含如下信号处理代码:
#include <dlfcn.h>
void sigUsr1Handler(int sig){

	....
    // 程序关闭前 处理必要操作

    // 处理 SIGUSR1 信号
    fprintf(stderr, "Received SIGUSR1 signal. Generating gmon.out file...\n");
    void (*_mcleanup)(void);
    _mcleanup = (void (*)(void))dlsym(RTLD_DEFAULT, "_mcleanup");
    if (_mcleanup == NULL)
         fprintf(stderr, "Unable to find gprof exit hook\n");
    else _mcleanup();
    _exit(0);
}

// 注册信号
signal(SIGUSR1, sigUsr1Handler);
编译外部依赖库:
这里使用
-Wl,--no-as-needed -ldl来解决 引入dlsym未定义的情况参考: [Saving gmon.out before killing a process](https://stackoverflow.com/questions/10205543/saving-gmon-out-before-killing-a-process)
#makefile

$(CXX) $(CXXFLAGS) -g -Wl,--no-as-needed -ldl -pg -fPIC -shared  $(SRC_PATH)/src.cpp -o $(LIB_PATH)/libmycode.so
最后当程序结束时,会调用_mcleanup,其定义在gmon/gmon.c中。
>void _mcleanup (void)
>{
 __moncontrol (0);

 if (_gmonparam.state != GMON_PROF_ERROR)
   write_gmon ();

 /* free the memory. */
 free (_gmonparam.tos);
>}
首先其通过__moncontrol(0)结束profil工作,其次通过write_gmon ()函数将profile信息输出到gmon.out文件中。
lib动态依赖库 测试? - gprof无法测试
gprof 无法分析动态依赖库
只能分析静态函数
故再测试 openssl 性能瓶颈时 ,静态编译
./Configure --prefix=$prefix_static \
no-shared \
'-L/home/workhome/llvm_test/llvm-tutorial-opt/work07/dev/lib -ltaintcpp.a'外部函数调用libtaintcpp.a文件
# makefile
$(AR) -c rsc $(LIB_PATH)/libtaintcpp.a $(LIB_PATH)/util.o
目前遇到的问题:
测试openssl 时, 编译静态libssl.a,libcrypto.a 文件 链接到openssl
但我的外部函数是C++,应用了STL库中函数,
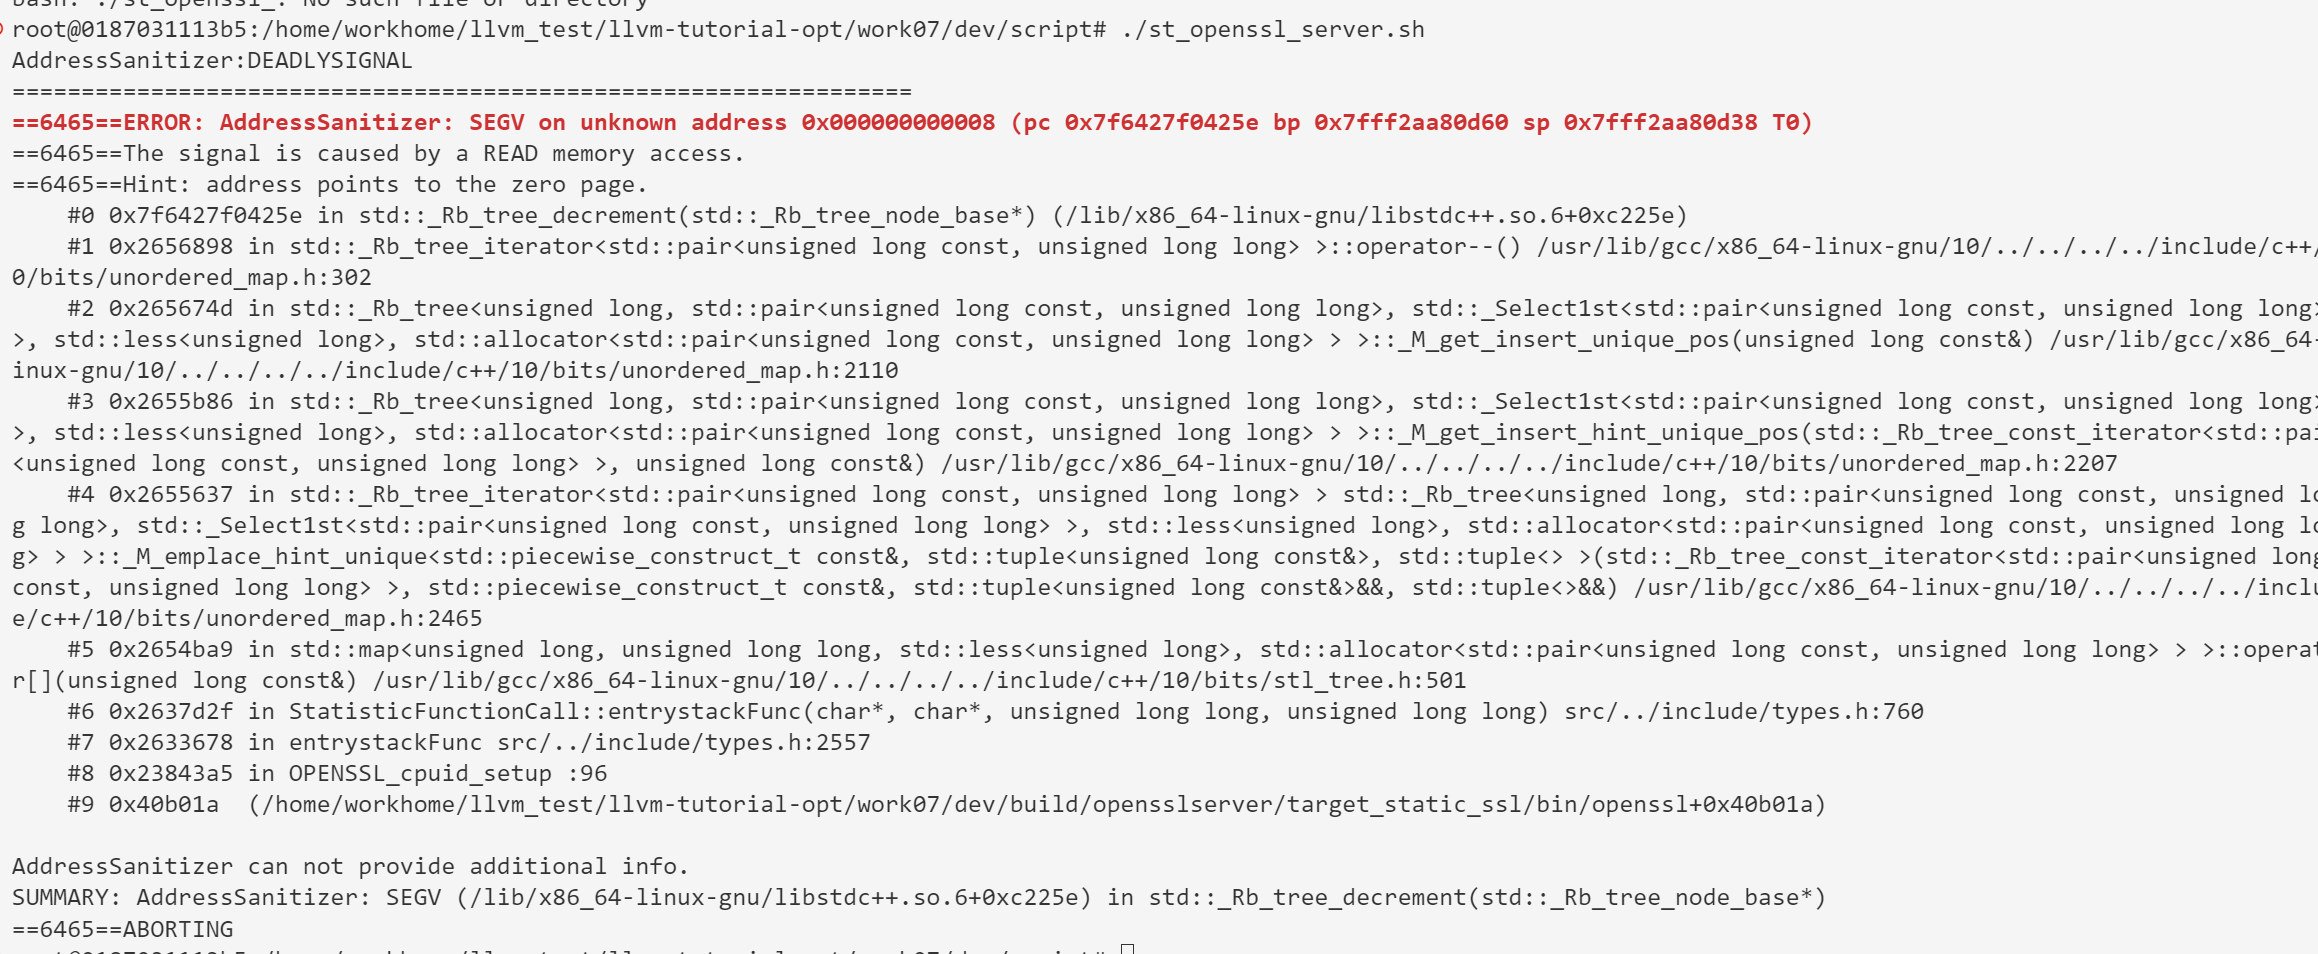
Clang 无法链接静态版本的libstdc++.a文件, 只能使用-lstdc++链接动态, 导致静态动态混用
https://blog.csdn.net/giantchen547792075/article/details/12780675/
在这片文章中提到 动态静态混用容易出现对内存申请和释放不是同一个堆上,所有会出错
正如下面运行图所示:
Google CPU Profiler
优势
google gprof 是支持动态依赖库测试的,也即.so/dll, 相比较 GNU gprof来说不需要特意编译成静态依赖库。
安装
$ sudo apt-get install libgoogle-perftools-dev google-perftoolshttps://github.com/gperftools/gperftools
git clone https://github.com/gperftools/gperftools
cd gperftools
./autogen.sh
./configure --prefix=`pwd`/gperftools-build --enable-frame-pointers
make
sudo make install
ln -s `pwd`/gperftools-build/lib/libprofiler.so /usr/lib/libprofiler.so注意事项:
https://github.com/gperftools/gperftools/blob/master/INSTALL
If you are on x86-64 system, know that you have a set of system
libraries with frame-pointers enabled, and compile all your
applications with -fno-omit-frame-pointer, then you can enable the
built-in perftools stack unwinder by passing the
--enable-frame-pointers flag to configure.

Even with the use of libunwind, there are still known problems with
stack unwinding on 64-bit systems, particularly x86-64.  See the
"64-BIT ISSUES" section in README.

If you encounter problems, try compiling perftools with './configure
--enable-frame-pointers'.  Note you will need to compile your
application with frame pointers (via 'gcc -fno-omit-frame-pointer
...') in this case.
https://gperftools.github.io/gperftools/cpuprofile.html
https://developer.ridgerun.com/wiki/index.php/Profiling_with_GPerfTools
使用
1.编译使用
编译时 添加-lprofiler 使其能够链接到libprofiler.so 动态库
或者在运行时使用:LD_PRELOAD运行时加载动态库
LD_PRELOAD=/usr/local/lib/libprofiler.so CPUPROFILE=test.prof ./path/to/bin
LD_PRELOAD: Path to the libprofiler.so usually located at /usr/local/lib/ or /usr/lib/x86_64-linux-gnu for 64 bit systems. 根据Configure --prefix= 来定, 如果没有设置--prefix 默认应在/usr/local/lib
CPUPROFILE: Name of the output log file
2.运行程序
使其正常结束, Ctrl+C 中断信号不会生成日志XXX.prof文件
Keep the application open or running until it finishes, in this mode if the execution is canceled for example with Ctrl+C the output file will not be generated.
2.运行中产生:
CPUPROFILE=test.prof CPUPROFILESIGNAL=12 ./path/to/bin
启动时添加CPUPROFILESIGNAL=12 , 信号标志,
当想开始计算时 kill -12 $PID
中间结束时 再次kill -12 $PID
获得 test.prof.0.... n
2.2 Also you can use killall command to send the -12 signal

killall -12 /path/to/bin
3. Leave the program until the point you want to profile it, then run again:

killall -12 /path/to/bin
You will notice the following output when the output file was correctly generated:

Using signal 12 as cpu profiling switch
PROFILE: interrupts/evictions/bytes = 4773/1826/231936
4. Once the application ended the test.prof.0 file contains the CPU profile information. To get a graphical output run:

google-pprof -gv ./path/to/bin test.prof
3.生成运行时间图
如果出现:
DWARF error: invalid or unhandled FORM value: 0x25
# 生成图片, 终端无法预览
google-pprof --gv ./path/to/bin test.prof

# 生成html预览,  终端无法预览
google-pprof --web ./path/to/bin test.prof
# 生成pdf, 生成后需要下载查看
google-pprof --pdf ./path/to/bin test.prof > output.pdf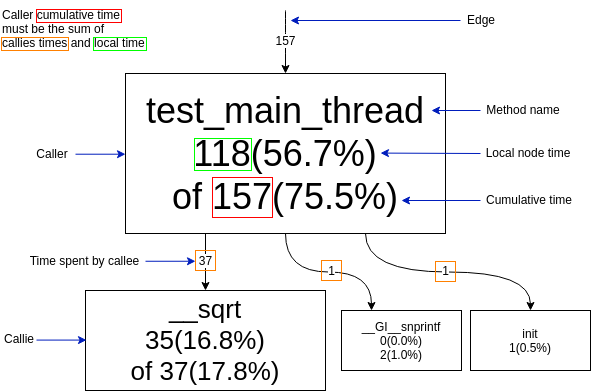
1个单位 大约10ms,
所以 118 ~= 1.18s
测试脚本
gprof2dot_path="path to gprof2dot"
#$1: Tested program (path of binary file)
#$2: Total execution time of tested program
# gprof 版本为2.34  不支持 DWARFV5
# 报错: BFD: DWARF error: invalid or unhandled FORM value: 0x25
#gprof $1 > $1.log
# 使用resources/binutils24lib/bin/gprof ,2.40版本可支持 DWARFV5
# 已提前 ln -s <path/to/resources/binutils24lib/bin/gprof> /usr/bin/gprof24
gprof24 $1 > $1.log
python3 ${gprof2dot_path}/gprof2dot.py -t $2 $1.log | dot -Tpng -o $1.pngtarget_openssl_path=path to binary file
id=$1
google-pprof --pdf ${target_openssl_path}/exe test.prof.${id} > test.prof_${id}.pdf